
Podscribe measured more than 97,000 podcast ad campaigns across over 30 billion impressions last year. Not one of those impressions proves a person heard your ad. A download is a file request, and file requests can fire while a phone charges overnight.
That gap is what podcast advertising metrics exist to close. This guide gives you the six numbers to track, the formulas behind them, and the 2026 benchmarks to judge them against. It pairs with our guide to common podcast advertising mistakes, which covers the errors that break campaigns before measurement starts.
Track episode completion rate, adjusted CPM, ad load, cost per acquisition, ROAS and attribution coverage. Set your CPA ceiling and ROAS target before you see a rate card, then measure over a 30 to 60 day window.
What podcast advertising metrics matter most? Episode completion rate, adjusted CPM, ad load, cost per acquisition, ROAS and attribution coverage. Downloads count file requests, not verified listens. Fix your CPA ceiling and ROAS target before any rate card arrives, and measure over a 30 to 60 day window.
1. Downloads Count Requests, Not Listeners
A download happens when a device pulls an episode file from a server. That pull can be automatic. It can fire while a listener sleeps and an app refreshes a show they stopped opening years ago.
The IAB Tech Lab sets the technical standard that strips bots and duplicate requests out of raw figures. It released Podcast Technical Measurement Guidelines v2.3 on July 21, 2026, open for public comment until August 19, 2026. The update covers audio and video podcasts distributed through open RSS feeds and podcast apps.
The same guidelines explain why the gap survives certification. Most podcast apps still do not confirm playback back to the server. Measurement therefore runs on server side log analysis, so a compliant download stays a request rather than a proven listen.
Nothing here says downloads are useless. They set the outer edge of who could have heard you. Every other metric in this guide narrows that edge toward the people who actually did.
Read every download figure as a ceiling. Then price the show against the smaller number underneath it, using the adjusted CPM formula in section 5.
2. The Six Metrics That Matter in 2026
Six numbers decide whether a podcast buy worked. Each one answers a question the download figure cannot, and each has a different source. The table below is the whole framework in one screen.
| Metric | What It Answers | Where the Number Comes From |
|---|---|---|
| Episode completion rate | Did the audience stay long enough to reach your ad | The show's hosting analytics or Spotify for Podcasters |
| Adjusted CPM | What you pay per thousand listeners who heard the ad | Your own calculation, from the rate card and completion rate |
| Ad load | How much of the episode is already advertising | The show, or an attribution platform such as Podscribe |
| Cost per acquisition | What one customer cost you through this channel | Your attribution stack, read over 30 to 60 days |
| ROAS | What the campaign returned against what it cost | Attributed revenue divided by spend, same window as CPA |
| Attribution coverage | How many conversions your setup can actually see | A pre-launch checklist of the methods you have live |
2026 reference points for each metric
These figures come from published campaign data, not from rate cards. Use them to filter shows and to sanity check results, never as promises.
| Benchmark | Figure | Source and Window |
|---|---|---|
| Host read conversion per impression | 0.021% median | Podscribe Q4 2025 benchmark report |
| Producer read conversion per impression | 0.019% median | Podscribe Q4 2025 benchmark report |
| Response rate, reached listeners who visited | 2.29% average | Magellan AI Q1 2026, 30 day lookback |
| Site visitor to lead conversion | 9.74% average | Magellan AI Q1 2026, 30 day lookback |
| Long term return on ad spend | 4.9 times, against 3.7 times across media | Acast study with Dentsu, campaign lifetime |
| Ad load, share of runtime given to ads | 10.9% | Podscribe Q1 2026, rolling 12 months |
| Brand awareness lift | 10 points over control | Nielsen brand impact norms, Q2 2025 |
One number in that table deserves a second look. Magellan AI reports that 2.29% of reached listeners visited the advertiser site, and that 9.74% of those visitors converted to a lead. Multiply the two and you get roughly 0.22% of reached listeners becoming a lead. That is the planning figure most media plans are missing.
Screening shows before you request any of this saves days. MillionPodcasts indexes 3M+ shows, 43.1K of them with a sponsor already on record. Its 17 filters cover audience size, listener demographics and episode length. You then ask only shortlisted shows for completion and rate card data.
Copy this table into your media plan and add a column for your own result. A benchmark you never compare against is decoration.
3. What Is a Good Episode Completion Rate?
Completion rate is the share of listeners who reach a set point in an episode, usually 80% of runtime. It is the most predictive engagement signal you can request, and first time buyers rarely ask for it.
Think about what the number represents. A listener who reaches the 80% mark of a 45 minute episode has given you 36 minutes of sustained attention. If your ad runs mid-roll, it landed inside that stretch.
How to read a completion rate you are given
These are buying filters, not published industry benchmarks. They exist to tell you when to press harder in a negotiation.
| Completion Rate | How to Treat It |
|---|---|
| Above 75% | Prioritise for direct response, and expect to pay a premium |
| 65% to 75% | Strong enough for most campaign goals |
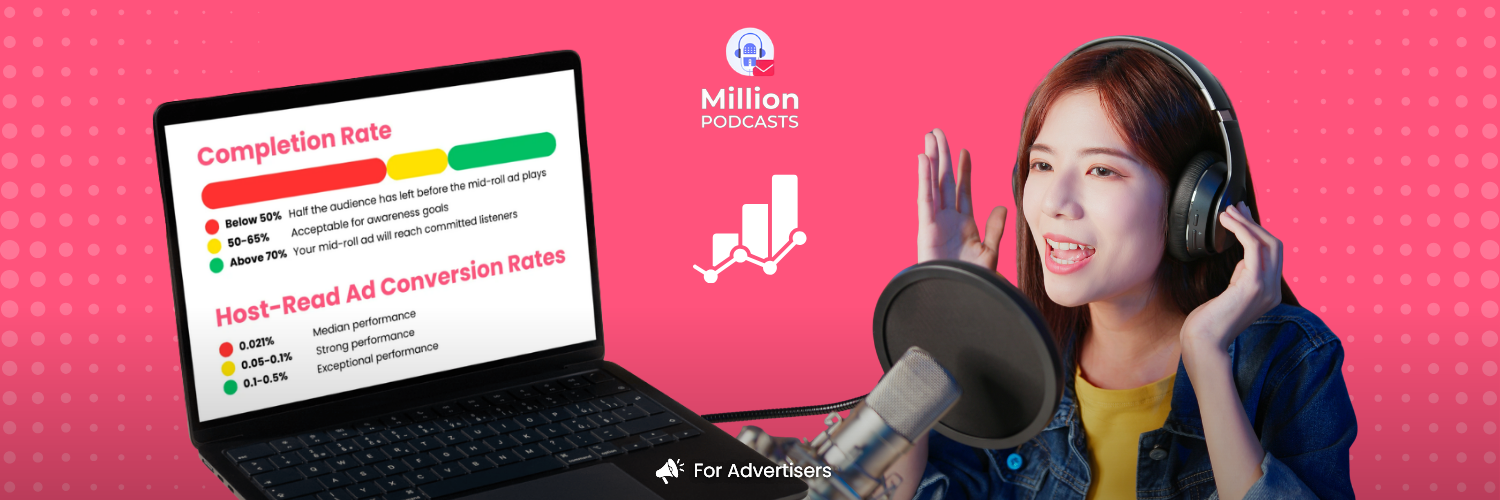
| 50% to 65% | Workable for awareness, thin for conversion goals |
| Below 50% | Ask what changed, and reprice using the adjusted CPM |
How to request the right number
Ask for completion data on episodes of the same length as the ones you will appear in. A 15 minute episode and a 90 minute episode on one show can behave very differently. Ask for mid-roll retention too, not only the show average.
Some shows cannot produce the figure at all. Treat that as information rather than a dead end. Shows with strong numbers usually offer them without being asked twice.
Request completion rate in your first email, before pricing is discussed. Once a rate card is on the table, the conversation is about money instead of audience.
4. Pre-Roll, Mid-Roll and Post-Roll Compared
Placement decides which listener state your ad meets. Pre-roll plays before the content. Mid-roll plays once the listener has committed time. Post-roll plays after the episode ends.
| Placement | When It Plays | Who It Reaches | Best Suited For |
|---|---|---|---|
| Pre-roll | Before episode content | Everyone who presses play, including quick skippers | Awareness and maximum raw reach |
| Mid-roll | Around 30% to 50% into the episode | Listeners already invested in the episode | Direct response and conversion goals |
| Post-roll | After episode content | The loyal segment that stays to the end | Reinforcement, at a lower CPM |
You will find precise listen-through percentages for each placement quoted across the web. Almost none of them trace back to a published study. Ask the show for its own placement level retention instead, and treat any figure it cannot evidence as an estimate.
Runtime is the missing number under ad load
Ad load is a share of runtime, so runtime decides what that share actually buys. A 10.9% ad load on a 20 minute episode is barely two minutes of airtime. The same percentage on a 70 minute episode runs close to eight.
So we checked our own MillionPodcasts database in August 2026 to see how long shows really run, and whether sponsored shows run longer. Every count below covers podcasts that published an episode in the last 12 months.
| Average Episode Length | All Active Shows | Shows With a Sponsor | Share Carrying a Sponsor |
|---|---|---|---|
| Under 10 minutes | 131.1K | 3K | 2.3% |
| 10 to 20 minutes | 99.3K | 4.1K | 4.1% |
| 20 to 40 minutes | 210.4K | 14.4K | 6.8% |
| 40 to 60 minutes | 124.2K | 11K | 8.9% |
| 60 to 90 minutes | 48.7K | 5K | 10.3% |
| Over 90 minutes | 16.7K | 1.5K | 9% |
Read the last column downward. Sponsors sit on 2.3% of shows under 10 minutes and on 10.3% of shows running 60 to 90 minutes. The rate climbs at almost every step up in length, then eases past 90 minutes.
The skew shows up in the totals as well. Of shows already carrying a sponsor, 44.9% run 40 minutes or longer, against 30.1% across all active shows. Advertisers are concentrated in the long half of the market, and the 20 to 40 minute bucket is where the unsold inventory sits.
Length alone does not earn a sponsor. Longer episodes simply hold more mid-roll inventory, and mid-roll is where direct response money goes. If a 15 minute show quotes you a mid-roll rate, ask exactly where in the runtime that spot lands.
What the published data does support
Podscribe found host read placements deliver a median 0.021% conversion per impression, ahead of producer read at 0.019%. Its Q1 2026 report also found direct show buys produce the strongest visitor and purchase rates. Programmatic buys deliver the lowest cost per acquisition, because CPMs are lower and targeting is broader.
Ad load is the placement factor buyers forget. Podscribe put ad load at 10.9% of episode runtime in Q1 2026, and performance generally falls as that share climbs. Host read spots hold up better than pre-produced ones in crowded episodes.
Ask two questions before comparing prices: what is your ad load per episode, and what retention do you see at each placement? Then run the adjusted CPM separately for every placement you are quoted.
5. Your CPM Is Not What the Rate Card Says
Once you hold a completion rate, you can work out what you really pay per engaged listener. No rate card does this adjustment for you. Run it yourself on every show you consider.
A $30 CPM on a show with 70% completion costs $43 per 1,000 listeners who stayed for your ad. The same $30 on a 40% completion show costs $75. The media kit shows the first number, and your finance team eventually sees the second.
The formula also reorders your shortlist. A $50 CPM show at 78% completion is a better buy than a $22 CPM show at 44%. Raw CPM comparison hides that completely.
Build the comparison sheet before you negotiate
Four columns are enough. Show name, published CPM, reported completion rate, adjusted CPM. Sort by the fourth column and the ranking rarely matches the second.
Where current CPM rates live
This guide teaches the adjustment, not the going rate. Our podcast advertising CPM rates guide carries current pricing by genre, show size and format. Bring the number it gives you back to the formula above.
When a show will not share completion data, price the buy at 50% completion and say so openly. Most shows would rather send the real figure than lose the booking.
6. Set Your CPA Ceiling Before You Negotiate
CPM tells you what impressions cost. Cost per acquisition tells you what a customer cost. Only the second one decides whether the campaign made money.
Your CPA ceiling comes from your margin, not from anyone's rate card. Work it out before you send the first email. Skip that step and the rate card quietly becomes your benchmark.
A $250 product at 55% margin nets $137.50 per sale. At a 2.3 times target return, your CPA ceiling is $60. That single number settles most internal arguments about whether a price is fair.
Project the outcome before you accept a price
Start from engaged listeners rather than downloads. Episode downloads multiplied by completion rate gives you the audience your ad can reach. A show with 10,000 downloads at 70% completion offers 7,000 engaged listeners.
Now apply a response estimate. Magellan AI measured a 2.29% visit rate and a 9.74% visitor to lead rate in Q1 2026. That works out near 0.22% of reached listeners becoming a lead. Against 7,000 engaged listeners, that is roughly 15 leads per episode.
At a $60 CPA ceiling, 15 leads justify about $900 per episode. If the show asks $600, you have headroom to test. If it asks $2,500, the maths only works with a far better conversion rate than the benchmark.
If a show can share its previous sponsor's conversion rate in a comparable category, use that instead of any benchmark. One real number from the same audience beats an industry average.
7. How to Calculate Podcast Advertising ROAS
Most advertisers can state what they spent. Far fewer can state what came back. ROAS answers that, but only after the attribution window closes.
A campaign costing $5,000 that attributes $23,500 in revenue returns 4.7 times. Whether that clears your bar depends on your margin, not on any published average. Set the bar with the same margin logic you used for your CPA ceiling.
An Acast study with Dentsu put long term podcast ROAS at 4.9 times. The average across media channels was 3.7 times. Long term is the operative phrase. Measured on a short window, the same campaign reports a fraction of that.
Choose direct or programmatic on the metric you care about
Podscribe found direct show buys deliver the strongest visitor and purchase rates per impression. Programmatic buys produced the lowest cost per acquisition, helped by cheaper inventory and broader targeting. Audience buys reached 25.4% of tracked impressions in Q1 2026, up from 19.3% a year earlier.
So the choice is not quality against junk. It is response rate against efficiency, and your ROAS target decides which one wins.
The 90 day lifetime value check
A $60 CPA looks expensive against a $90 product and sensible against a subscription that retains for 18 months. After your window closes, pull the 90 day value of customers attributed to the campaign. Compare it against your channel average.
If podcast customers are worth 1.4 times your average, a campaign reporting 3.0 times ROAS is really returning 4.2 times. That comparison decides whether podcast joins your permanent media mix.
Pull ROAS at day 30 and again at day 60. A figure still climbing between those dates means the window is open and any cancellation at day 30 would have been premature.
8. Fill In This Scorecard Before Signing
Campaigns without pre-agreed targets end in interpretation. Results arrive, and the meeting becomes a debate about what the numbers might mean. A scorecard written before launch removes that debate.
| Metric | Your Target | Tracking Method | Window |
|---|---|---|---|
| Episode completion rate | Your threshold from section 3 | Hosting analytics | Per episode |
| Adjusted CPM | Recalculated, not published | Rate card and completion rate | Per episode |
| Ad load | Compare against 10.9% benchmark | Show or attribution platform | Per episode |
| Cost per acquisition | Your ceiling from section 6 | Codes, pixel and survey combined | 60 days |
| ROAS | Your minimum from section 7 | Attributed revenue divided by spend | 60 days |
| Attribution coverage | Three or more methods live | Pre-launch checklist | Launch day |
| Brand recall lift | Compare against 10 point norm | Third party survey | Post campaign |
| Renewal threshold | CPA within 20% of your ceiling | Blended attribution | 60 days |
Share the finished sheet with everyone who will comment on results. If a metric was not on it before launch, it cannot become the headline KPI afterwards.
Media structure is a separate decision
How many shows and how many episodes is a planning question, not a measurement one. Cumulus Media's 2025 Audioscape found no brand is close to saturating podcast audiences. It recommends putting 5% of digital budgets into the channel. Underspending, not overspending, is the common failure.
Our guide to testing podcast ad campaigns covers how to structure a pilot before you commit real budget.
Every metric on this page is worth more before you sign than after. Targets set in advance turn results into a decision. Targets set afterwards turn results into an argument.
Build the shortlist this framework runs on
Search 3M+ podcasts by audience size, listener demographics, sponsor history and category. Unlock verified host and booker contact details, then export your shortlist to CSV or Excel before you request a single rate card.
Search 3M+ podcasts →9. How to Measure Podcast Ad Performance
No pixel fires when a listener hears your ad. There is no link to click at the moment of exposure. Someone hears you on Monday, thinks it over, and buys on Thursday from a different device.
Whether that purchase appears in your data depends entirely on what you built before episode one. Four methods together give you the fullest picture, and each catches conversions the others miss.
- Unique promo codes: one code per show tells you exactly which show drove a sale. Create the code before the host records, because changes afterwards need a re-record. Two word codes are easier to remember than alphanumeric strings.
- Vanity URLs: a show specific slug on your domain tracks clicks and landing page visits. The host needs the exact URL to speak it, so set it up before recording. Send it to a dedicated page so non-buyers still enter your remarketing pool.
- Pixel based attribution: platforms such as Podscribe or Claritas match converted customers against listener data to identify the episodes they heard. This catches the listener who searched your brand and never touched a code.
- Post purchase surveys: one question at checkout asking where the customer heard about you. List podcast as an option alongside show names. It surfaces conversions every automated method missed.
Why a 7 day window hides working campaigns
Podcast conversions do not arrive on a tidy schedule. Magellan AI measures its own response benchmarks on a 30 day lookback from ad exposure, which reflects how slowly listeners act. Close your window at day 7 and most of that response never reaches your report.
Conversions also tend to arrive in waves. One cluster lands in the days right after an episode drops. Another follows from listeners who downloaded early and played late, and a third trickles in as new listeners find the back catalogue.
Measuring awareness when there is no link
Some campaigns exist to shift perception rather than close sales. Brand lift is measured by surveying listeners of your shows. Compare their answers against a control group that never heard the ads.
Nielsen's brand impact norms give you the yardstick for that comparison.
Nielsen also found 70% of exposed listeners recalled the advertised brand. Sounds Profitable, surveying 5,005 US adults with Signal Hill Insights, recorded an 86% ad recall rate among the most active podcast users. That was the highest recall of any ad supported medium in the study.
A cheaper signal sits in your own analytics. Branded search volume in the days after an episode drops tells you whether attention moved, and it costs nothing to check.
Treat attribution as a launch requirement, not a follow up task. Assign the code and URL before you send creative. Set the attribution window to 30 to 60 days before day one.
10. What Your Data Says at 30 and 60 Days
Campaign data arrives in stages, so one snapshot date gives you a misleading picture. Two fixed checkpoints give you enough signal to decide without missing the renewal window.
The 30 day read
At day 30 you have direction, not a verdict. Review promo redemptions and vanity URL traffic. Then pull branded search for the seven days after each episode and compare it with your previous four week baseline.
A branded search rise that holds for several days is a real signal. It often appears while code redemptions still look flat, because most listeners never use the code.
The 60 day read
At day 60 the direct response picture is complete. Pull fully loaded CPA across every attribution method and set it against your ceiling. Calculate ROAS over the full window, then read the trend across episodes.
| Signal | What You See | What to Do |
|---|---|---|
| Rising | Conversions climb across episodes, branded search holds above baseline, CPA trending down | Renew and add frequency on the same show |
| Flat | Conversions steady, branded search unmoved, CPA sitting at your ceiling | Change one variable: the offer, the code value or the call to action |
| Declining | Conversions fall after episode one, branded search below baseline, CPA more than 20% over ceiling | Move budget to a better matched show rather than spending more here |
Before you call a flat result a failure, check the size of the buy. Cumulus Media's Audioscape work found most brands are nowhere near saturating podcast audiences. A campaign too light to register is a different problem from a campaign in the wrong place.
Put both review dates in the project plan before launch. Decisions made on fixed checkpoints beat decisions made whenever the data happens to land.
If you are buying for direct response, pick one well matched show and measure it properly for 60 days. One show with clean attribution teaches you more than five shows with none.
If you are buying for awareness, agree the lift study with a measurement partner before launch. Then hold the same shows long enough to survey the audience that heard you.
Either way the first hour of work is identical. Open a sheet and write your CPA ceiling and ROAS target. List the four attribution methods that will be live on day one. Do that before you request a single rate card, and every number that follows means something.
11. Podcast Advertising Metrics FAQ
What podcast advertising metrics matter most?
Six numbers decide whether a campaign worked: episode completion rate, adjusted CPM, ad load, cost per acquisition, ROAS and attribution coverage. Downloads sit outside that list because they count file requests. Fix your CPA ceiling and ROAS target before a rate card reaches you.
How do you measure podcast advertising performance?
Run four attribution methods at once. Use a unique promo code per show, a vanity URL, pixel based attribution and a post purchase survey. Each one catches conversions the others miss. Put all four live before the first episode airs, because data you did not capture cannot be recovered later.
What is a good episode completion rate for podcast advertising?
Above 70 percent is strong for direct response, because a listener who finishes the episode almost certainly heard a mid-roll. Between 50 and 65 percent still works for awareness goals. Below 50 percent, ask why before you commit budget.
How long should a podcast attribution window be?
Use 30 to 60 days. Magellan AI measures its own response benchmarks on a 30 day lookback from ad exposure. Listeners routinely convert days later, often on another device. A 7 day window makes working campaigns look like failures.
How is ROAS calculated for podcast advertising?
Divide revenue attributed to the campaign by total ad spend, using the same window you use for cost per acquisition. An Acast study with Dentsu put long term podcast ROAS at 4.9 times, against a 3.7 times average across media channels.
How long is the average podcast episode?
MillionPodcasts data from August 2026 shows the 20 to 40 minute bucket is the single largest, at 210.4K shows active in the last 12 months. Shows carrying a sponsor sit longer, with 44.9 percent of them running 40 minutes or more against 30.1 percent of all shows.
How do you measure podcast success without a promo code?
Watch branded search volume in the days after each episode drops, and compare it with your baseline. Add pixel based attribution to catch listeners who search your brand instead of typing a code. For awareness campaigns, a survey against a control group is the only reliable read.
References
IAB Tech Lab. (July 2026). Podcast Technical Measurement Guidelines v2.3: release date, public comment period, and audio plus video coverage across open RSS distribution. https://iabtechlab.com/standards/advanced-tv/podcast-technical-measurement-guidelines-v2-3/ IAB Tech Lab, via Podnews. (July 2026). Guidelines v2.3 press release: podcast applications do not provide client side playback confirmation, so measurement relies on server side log analysis. https://podnews.net/press-release/iab-tech-lab-v23-public Podscribe. (2026). Performance Benchmark Report Q1 2026: 97,000 plus campaigns and 30 billion plus impressions measured between January and December 2025. https://podscribe.com/ppb-reports/q1-26 Podscribe, reported by Inside Radio. (June 2026). Q1 2026 benchmark findings: 10.9% ad load, 25.4% audience buy share against 19.3% a year earlier, direct show buys strongest on visitor and purchase rates, programmatic lowest cost per acquisition. https://www.insideradio.com/free/podcast-ad-retargeting-and-audience-buys-gain-momentum-podscribe-finds/article_620ed4d4-20c2-45d8-b2f6-1d57b39ab8dc.html Podscribe, reported by ADOPTER Media. (2026). Q4 2025 Performance Benchmark Report: host read median conversion rate of 0.021% per impression against 0.019% for producer read. https://adopter.media/podcast-advertising-guide/ Magellan AI, reported by PPC Land. (June 2026). Q1 2026 Podcast Measurement Benchmark Report: 2.29% average response rate on a 30 day lookback and 9.74% lead conversion. https://ppc.land/podcast-ads-convert-at-5-22-what-magellan-ais-q1-data-actually-shows/ Acast with Dentsu. (2026). How to Measure Success in Podcast Advertising for Every Objective: long term podcast ROAS of 4.9 times against a 3.7 times average across media. https://www.acast.com/en/news-and-insights/how-to-measure-success-in-podcast-advertising-for-every-objective Nielsen, reported by Radio Ink. (August 2025). Podcast Brand Impact Norms, Q2 2025: 10 point awareness lift, 8 point information seeking lift, 6 point purchase intent lift, and 70% brand recall among exposed listeners. https://radioink.com/2025/08/21/nielsen-podcast-ads-boost-brand-metrics-across-verticals/ Sounds Profitable with Signal Hill Insights. (June 2025). The Advertising Landscape 2025, Attention and Trust: 86% ad recall among the most active podcast users, from a survey of 5,005 US adults. https://soundsprofitable.com/research/the-advertising-landscape-2025-part-two-attention-and-trust/ Cumulus Media, Westwood One. (January 2025). Four New Findings About Podcast Advertising From the 2025 Audioscape: campaigns are too light to saturate podcast audiences, with a 5% digital budget allocation recommended. https://www.westwoodone.com/blog/2025/01/21/four-new-findings-about-podcast-advertising-from-cumulus-medias-2025-audioscape/ MillionPodcasts. (August 2026). Database counts for podcasts with an episode published in the last 12 months, split by average episode length and by the Has Sponsor filter: 131.1K, 99.3K, 210.4K, 124.2K, 48.7K and 16.7K shows by length bucket, and 3K, 4.1K, 14.4K, 11K, 5K and 1.5K of those carrying a sponsor. https://www.millionpodcasts.com/podcasts-directory MillionPodcasts. (2026). Our Database: 3M+ total podcasts, 43.1K podcasts with sponsors, and 17 search filters across audience size, listener demographics and episode length. https://www.millionpodcasts.com/